
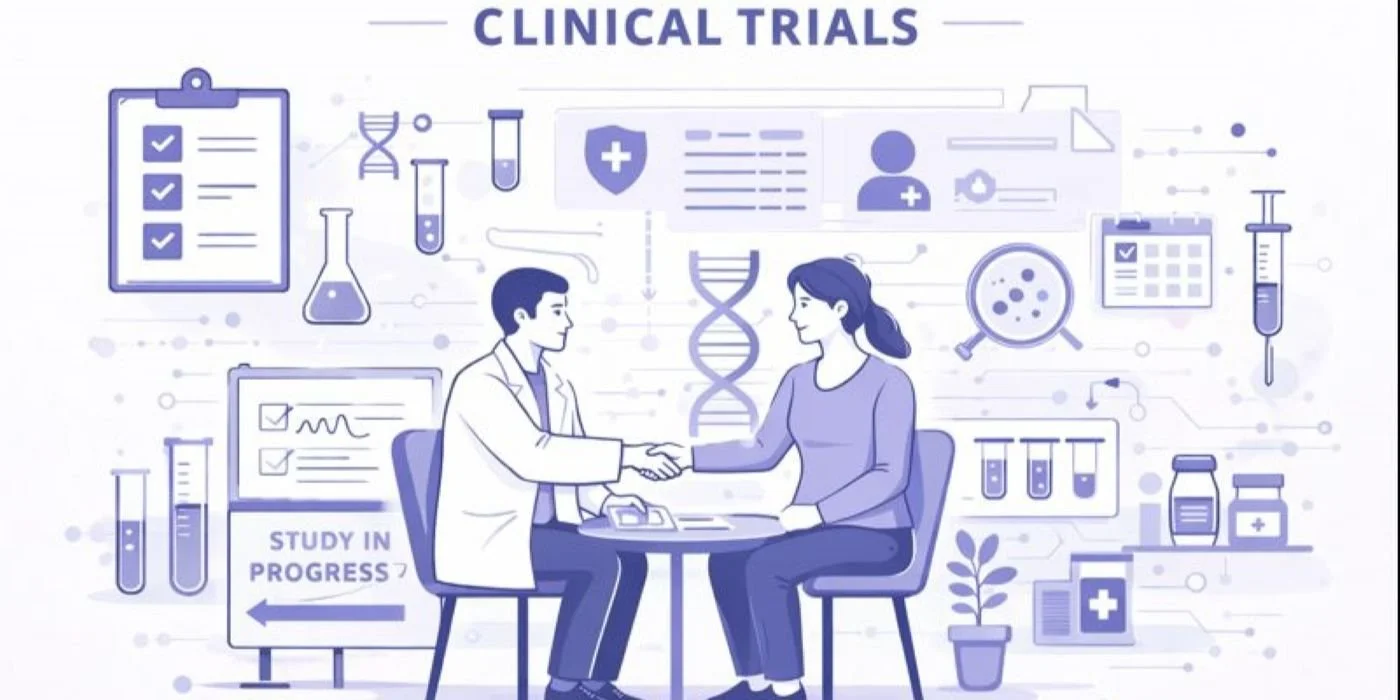
Biostatistics in Clinical Trials: A Beginner-Friendly Overview
Biostatistics can feel like a locked door in clinical research. You read protocols, see p values, confidence intervals, and “power,” and suddenly it sounds like a different language. The problem is not that you are “bad at math.” It is that most explanations skip the practical why and jump straight into formulas. This overview keeps it beginner friendly and trial focused, so you can understand what the stats section is trying to prove, how results are judged, and how to spot weak evidence before it costs you time, credibility, or career momentum.
1. Why Biostatistics Is the Backbone of Credible Clinical Trials
Biostatistics is how a trial turns messy human reality into decisions regulators, sponsors, and clinicians can trust. Without it, a “positive study” is just a story that might collapse under scrutiny. When you understand the basics, you stop reading outcomes like marketing and start reading them like evidence.
A beginner mistake is to treat stats as a final step that happens after data collection. In real trials, stats drives the entire architecture. It shapes endpoints, inclusion criteria, visit schedules, data quality rules, and the exact questions the study is allowed to answer. That is why roles across the ecosystem care about it, from clinical research assistants to clinical data managers to regulatory affairs specialists.
If you are aiming for higher responsibility roles, stats literacy becomes a gatekeeper. A principal investigator must defend the study’s conclusions. A sub investigator must ensure assessments are clinically sound. A clinical research project manager must manage risks tied to protocol deviations and missing data.
Here are the pain points where biostatistics saves you:
You stop over trusting “statistically significant” and start asking “clinically meaningful.”
You learn why trials fail even with great science, because endpoints, variance, and effect size were misjudged.
You can explain results to stakeholders without hiding behind jargon, which is a career accelerant in sponsor and CRO settings.
You avoid expensive mistakes in data cleaning and analysis planning by understanding what data must exist for valid conclusions, especially in clinical data coordinator workflows.
If you are studying for exams, this topic also shows up constantly. Build the right habits with proven test taking strategies and a stronger routine using the perfect study environment.
2. Core Biostatistics Concepts You Will See in Every Protocol
If you only learn one thing, learn this: a trial is a question with strict rules. Biostatistics is the rulebook. The protocol defines what will be measured, when it will be measured, and how success will be declared. That is why the stats section is tightly connected to operations and not just “analysis.”
Start with endpoints. A primary endpoint is the single most important outcome the study is designed to answer. That endpoint controls sample size, visit timing, and even the training that sites need. When teams get endpoints wrong, the trial can “work” biologically but still fail to convince decision makers. This affects roles like clinical research administrators who must keep execution aligned, and quality assurance specialists who audit whether data can support claims.
Next, learn effect size. Trials do not succeed because the p value is small. They succeed because the effect size is large enough to matter in real patients. A tiny improvement can look “significant” in a huge trial and still be clinically meaningless. This is why you will see intense debate around benefit risk framing in safety heavy functions like pharmacovigilance and drug safety.
Confidence intervals are your best friend as a beginner because they show both direction and precision. A narrow interval means the estimate is stable. A wide interval means the trial is under powered or outcomes are noisy. When you read clinical research salary reporting and see what higher level roles earn, what you are really seeing is the market paying for people who can judge evidence and risk with confidence.
Finally, understand analysis sets. Intention to treat is the default in many randomized trials because it preserves the integrity of randomization. Per protocol analyses can be helpful, but they are more vulnerable to bias. If a study only looks good when you remove “messy” patients, you should be skeptical. This matters in oversight roles like medical science liaison and clinical medical advisor where you must communicate results without overselling.
3. Study Designs, Randomization, and What They Protect You From
Trial design is a bias control system. Every design choice is trying to prevent a specific way humans accidentally fool themselves. Once you see it that way, the jargon becomes logical.
Randomized controlled trials exist because patient outcomes can improve or worsen for reasons unrelated to the drug. Disease severity, site differences, adherence, and even clinician expectations can move outcomes. Randomization helps distribute these forces across groups so the comparison is fair. Stratification is often added because teams know certain variables are too influential to leave to chance, such as baseline severity or region.
Blinding exists because measurement is fragile. If clinicians or patients know the assigned treatment, symptom reporting and assessment can shift. Even lab driven endpoints can be influenced by behavior, follow up, and dropouts. When blinding breaks, missing data often rises, and the analysis becomes less trustworthy. That is why operational teams lean on strong process in areas like clinical trial assistant workflows and monitoring support tools, especially as hybrid work expands.
Observational studies and registries are valuable, but they answer different questions. They often capture real world effectiveness and safety signals, yet they are more vulnerable to confounding. That is where biostatistics becomes even more important because adjustment methods must be chosen and defended. If you want to move toward leadership in evidence generation, learning the logic here will make you stand out in interviews.
A common beginner pain point is feeling lost in the protocol because it reads like a legal document. A practical shortcut is to map the trial into five items:
Population: who exactly is included and excluded
Intervention: what is delivered, dose, schedule
Comparator: placebo, standard of care, active control
Outcome: what is measured, and when
Estimand: what the trial is truly estimating under real world events
When you can summarize those five items, you can follow almost any methods section. This skill becomes especially valuable if you later specialize into data heavy tracks like lead clinical data analyst or safety heavy tracks like pharmacovigilance manager pathways.
4. How to Read Trial Results Like a Professional: P Values, CIs, and Effect Sizes
Most beginners get trapped in one number. They see p < 0.05 and stop thinking. That is exactly how weak claims survive. A stronger reading uses three layers: direction, size, and certainty.
Direction is simple: did the treatment help or harm. Size is the effect size: how much difference did it make. Certainty is the confidence interval: how precise is that estimate. A trial can be “statistically significant” and still be unimpressive if the improvement is tiny, the confidence interval is wide, or the endpoint is a surrogate with unclear patient impact.
Here is a practical mental model. If a result is significant but the confidence interval is wide, the study is telling you: “We saw a signal, but we do not know the true size.” That matters because labeling, reimbursement, and guideline changes depend on magnitude, not vibes. This is why medical communication roles value precision, including MSL pathways and pay focused roles that track market trends like clinical research coordinator salary guides.
Also, be cautious with subgroup results. A forest plot can make anything look exciting. But subgroups often have lower sample sizes, more noise, and more multiple comparisons. If a subgroup was not pre specified, treat it as hypothesis generating. This perspective helps you avoid being misled by “post hoc wins,” which show up a lot in slide decks and less in regulatory decisions.
Finally, understand that a p value is not proof of truth. It is a measure of how surprising your data is under a “no effect” assumption. It is sensitive to sample size. That is why massive trials can generate small p values for small effects. When you pair p values with confidence intervals and clinical relevance, you become harder to manipulate and more trusted in team discussions.
If you want a faster path to competence, spend time with real reports and structured learning habits. Use clinical research exams study strategies to turn reading into repetition that sticks, and build stamina using the study environment blueprint.

5. Biostatistics Career Leverage: How Beginners Turn This Skill Into Faster Promotions
Biostatistics is a multiplier. It makes you better at your current job and more credible when you ask for more responsibility. The reason is simple: trials are expensive and risky, so leaders promote people who reduce risk and increase clarity.
If you are early career, stats literacy helps you contribute beyond task execution. A clinical research assistant who can catch endpoint mapping issues or query patterns becomes unusually valuable. A clinical trial assistant who understands what drives missing data can push better site follow up and protect primary endpoints. A clinical data coordinator who understands analysis sets can flag deviations that will matter later, not just “close queries.”
If you are moving into safety, stats helps you interpret signals without panic. Pharmacovigilance work is full of noise, confounding, and reporting bias. Understanding rates, denominators, and uncertainty is what separates thoughtful signal assessment from reactive escalation. CCRPS paths like pharmacovigilance specialist growth and pharmacovigilance manager steps become easier when you can follow the underlying evidence logic.
If you are moving toward regulatory, stats is a language of persuasion. Regulators do not accept confidence. They accept pre specified plans, transparent assumptions, and robust sensitivity checks. That is why the bridge between biostatistics and compliance is strong in paths like regulatory affairs associate and clinical regulatory specialist.
A practical way to accelerate is to build “micro fluency” in the topics that show up everywhere:
Be able to explain p value, confidence interval, and effect size without formulas
Be able to explain power and why missing data reduces effective sample size
Be able to explain why subgroups can mislead and how multiplicity creates false positives
Be able to explain intention to treat and why it protects randomization
Pair that learning with exam readiness habits, using test taking strategy guidance and the ideal study environment setup. The result is not just a pass. It is a stronger professional identity.
6. FAQs
-
No. What you need is reasoning, not algebra. The most important skills are understanding what the trial is trying to estimate, what could bias that estimate, and how uncertainty should be communicated. You can learn p values, confidence intervals, and power without heavy computation if you focus on meaning and decision impact. A strong starting point is to study how real teams work across roles like clinical research assistants and clinical data managers. Then reinforce learning using proven test taking strategies so concepts stick under pressure.
-
Use a simple sequence: identify the primary endpoint, check the comparison groups, read effect size and confidence interval first, then look at the p value. After that, scan missing data and sensitivity analyses. This method stops you from being hypnotized by “significance” and forces you to evaluate real magnitude and precision. It also helps you detect when results are fragile. If you want to build this skill for career growth, it connects strongly to paths like medical science liaison and clinical medical advisor.
-
Because significance is not the same as usefulness or reliability. A result can be significant but clinically trivial, or significant but imprecise, or significant only after many unplanned comparisons. Regulators and reviewers care about pre specification, multiplicity control, and robustness under alternate assumptions. If the story changes when you handle missing data differently, the confidence drops fast. This is especially important in compliance oriented work like regulatory affairs specialist and clinical regulatory specialist.
-
A p value answers, “How surprising is this data if there were truly no effect?” A confidence interval answers, “What effect sizes are plausible given what we observed?” Practical decisions need the interval because it communicates both direction and precision. If the interval is wide, you might have a signal but not a dependable estimate. If the interval excludes a clinically meaningful threshold, the result becomes more persuasive. Learning to interpret intervals is a career advantage for people tracking evidence quality in roles like clinical research project management and data driven tracks like lead clinical data analyst.
-
Missing data can change the truth, not just the spreadsheet. If people drop out because of adverse events or lack of benefit, the remaining data is no longer a fair reflection of the original randomized comparison. This can inflate or hide effects depending on who leaves and why. Strong trials plan missing data strategies in advance and test results under different assumptions using sensitivity analyses. Operationally, this is why follow up discipline matters, and why data integrity roles like quality assurance specialist and data coordination roles like clinical data coordinator carry real scientific impact.
-
Expect heavy coverage of endpoints, randomization, blinding, p values, confidence intervals, power, analysis sets like intention to treat, and basic bias concepts. You will also see practical scenarios like protocol deviations and missing data implications because they connect statistics to real trial execution. If you want an efficient preparation approach, combine structured practice using test taking strategies with focus and retention improvements from the study environment guide. This method helps you answer questions with reasoning, not memorization.
-
Because it increases trust. When you can explain results clearly, detect weak evidence early, and anticipate analysis risks, you reduce expensive surprises. Teams promote people who prevent bad decisions and defend good ones. This shows up across the industry, from broader benchmarks like the clinical research salary report to role specific progression in tracks like pharmacovigilance and regulatory affairs associate. Even small improvements in how you read and communicate evidence can shift your perceived seniority.