
Clinical Trial Sample Size Calculator: Instant Interactive Tool
A clinical trial sample size calculator sounds like a simple planning tool, but in real research it sits at the center of cost, feasibility, ethics, statistical credibility, and study survival. If the sample is too small, the trial may miss a real effect, waste participant effort, and produce weak conclusions. If it is too large, the study can become slower, more expensive, harder to manage, and ethically inefficient. That is why an instant interactive calculator is not just convenient. It is one of the fastest ways to turn abstract study design into a more disciplined decision.
The danger is that many teams use sample size calculators mechanically. They plug in a few numbers without understanding effect size assumptions, variance, dropout, power, endpoint type, or what the output actually means operationally. A strong calculator should not only generate a number. It should force better design thinking, better assumptions, and better conversations across clinical, statistical, and operational teams.
1. Why a clinical trial sample size calculator matters far more than most teams realize
Sample size is one of the first places where scientific ambition collides with operational reality. On one side, the study team wants enough participants to detect a meaningful treatment effect with credible statistical power. On the other side, sites must recruit those participants, retain them, monitor them, schedule them, capture their data, and keep them safe. That tension is exactly why sample size planning is not a narrow statistics problem. It is a whole-study design problem.
A strong sample size calculator matters because it translates assumptions into consequences. Once you adjust power from 80% to 90%, or change the expected effect size, or account for higher variability, or factor in dropout, the enrollment burden can shift dramatically. What looked like a manageable study can suddenly become a budget problem, a recruitment problem, or a retention problem. This is why sample size thinking connects directly to biostatistics in clinical trials, clinical trial success rates by therapeutic area, clinical trial patient recruitment and retention trends, and clinical trial resource allocation.
The calculator also matters ethically. Underpowered trials can expose participants to risk, burden, procedures, and time commitments without a strong chance of answering the scientific question. Oversized trials can expose more people than necessary because the design team lacked discipline in defining a realistic effect and a defensible power target. Ethics in research is not just about consent and safety reporting. It is also about designing studies that are proportionate, purposeful, and statistically honest. That links sample size planning to informed consent procedures, patient safety oversight in clinical trials, regulatory and ethical responsibilities for principal investigators, and handling clinical trial audits.
Another reason the calculator matters is that modern studies rarely fail because a formula was unavailable. They fail because teams entered unrealistic assumptions. They guessed an effect size that was too optimistic, underestimated variance, ignored screen failure, minimized dropout, or acted as though protocol burden would not reduce completion rates. A good interactive calculator should therefore do more than compute. It should educate the user about what each assumption means and where weak assumptions usually destroy a study.
This is especially important for teams designing protocols in crowded, difficult, or noisy settings. In CNS studies, placebo response can distort signal. In oncology, endpoint timing and stratification complexity can change event requirements. In decentralized or hybrid studies, dropout assumptions may shift based on participant burden and digital adherence. In rare disease trials, recruitment feasibility may be more restrictive than the statistical ideal. That is why sample size planning is tightly linked to case report form best practices, randomization techniques in clinical trials, blinding in clinical trials, and primary vs secondary endpoints.
The best sample size calculator, then, is not just an instant tool. It is a pressure test. It reveals whether a team’s statistical hopes are compatible with its operational capacity. That alone makes it one of the most valuable interactive tools a clinical research site, sponsor, CRO, or coordinator can use.
| Calculator Input or Design Factor | What It Means | Why It Changes Sample Size | Common Mistake | Best Practice |
|---|---|---|---|---|
| Primary endpoint type | Continuous, binary, time-to-event, or other outcome | Each endpoint uses different statistical assumptions | Using the wrong formula family | Match calculator type to endpoint exactly |
| Effect size | Expected treatment difference | Smaller effects require larger samples | Choosing an unrealistically large effect | Base on prior data or justified clinical relevance |
| Standard deviation | Expected variability in outcome | Higher variability inflates needed sample | Underestimating outcome noise | Use credible historical or pilot estimates |
| Power | Probability of detecting a true effect | Higher power demands more participants | Treating 90% as free | Align power target with stakes and feasibility |
| Alpha level | False positive threshold | More stringent alpha increases sample needs | Ignoring multiplicity implications | Use the planned inferential framework |
| Allocation ratio | Randomization balance between groups | Unequal ratios often need more total participants | Ignoring efficiency loss in 2:1 or 3:1 designs | Model allocation deliberately |
| Dropout rate | Expected loss after enrollment | Higher dropout means more participants needed upfront | Using overly optimistic completion assumptions | Inflate sample realistically for attrition |
| Screen failure rate | Participants who never qualify | Raises recruitment burden beyond randomization target | Confusing randomized N with screened N | Show both screened and randomized estimates |
| One-sided vs two-sided test | Directionality of inference | Two-sided tests are more demanding | Choosing one-sided for convenience | Use only when scientifically justified |
| Event rate | Expected frequency for binary or event outcomes | Rare events often need bigger studies | Guessing baseline rate badly | Use epidemiologic or prior trial evidence |
| Hazard ratio assumption | Expected relative effect in time-to-event trials | Smaller hazard ratio differences need more events | Ignoring event-driven design logic | Plan for events, not just headcount |
| Follow-up duration | Observation time per participant | Longer follow-up may reduce headcount need in event studies | Not linking time with event accrual | Model follow-up and accrual together |
| Accrual period | Time allowed to recruit | Shorter accrual can weaken event capture and feasibility | Assuming recruitment speed without evidence | Tie accrual assumptions to site reality |
| Cluster design effect | Loss of efficiency from clustered data | Intraclass correlation inflates sample size | Ignoring clustering entirely | Apply design effect explicitly |
| Stratification plan | Balancing key prognostic groups | Complex designs may affect analysis assumptions | Separating randomization from analysis logic | Keep design and analysis aligned |
| Interim analysis | Planned look before final analysis | Alpha spending can alter sample requirements | Forgetting adjustment for interim looks | Coordinate with monitoring plan |
| Multiplicity | Multiple comparisons or endpoints | Stricter inference can require more data | Pretending multiple tests are free | Reflect adjustment strategy early |
| Noninferiority margin | Allowed loss versus control | Tighter margins drive larger samples | Choosing margin for convenience | Justify clinically and statistically |
| Superiority margin | Minimum clinically meaningful advantage | Defines what effect is worth detecting | Using statistical detectability alone | Tie effect to clinical relevance |
| Baseline imbalance risk | Smaller samples are more vulnerable to random imbalance | May distort apparent treatment effect | Thinking formula output guarantees robustness | Assess operational fragility too |
| Site recruitment capacity | Real enrollment ability by site network | Limits whether the target is feasible | Treating statistical target as automatically achievable | Pair calculator output with feasibility review |
| Protocol burden | Visit complexity and participant effort | High burden increases attrition and missingness | Ignoring burden in dropout inflation | Adjust attrition using actual burden |
| Endpoint reliability | How consistently the outcome is measured | Noisier measurement can require more participants | Assuming perfect measurement | Account for real measurement quality |
| Missing data risk | Uncollected or unusable outcomes | Reduces effective sample size | Assuming all randomized participants contribute usable data | Model realistic evaluable N |
| Subgroup ambitions | Desire to analyze subsets | Meaningful subgroup analysis may require much larger samples | Planning subgroup claims on a main-study N | Separate exploratory from confirmatory aims |
| Rare disease prevalence | Upper ceiling on recruitable population | May make ideal sample impossible | Designing for a fantasy population | Use adaptive or alternative strategies when needed |
| Regulatory expectation | Evidence standard for the decision being supported | Higher-stakes decisions may demand stronger design assurance | Using one-size-fits-all power logic | Match sample planning to decision context |
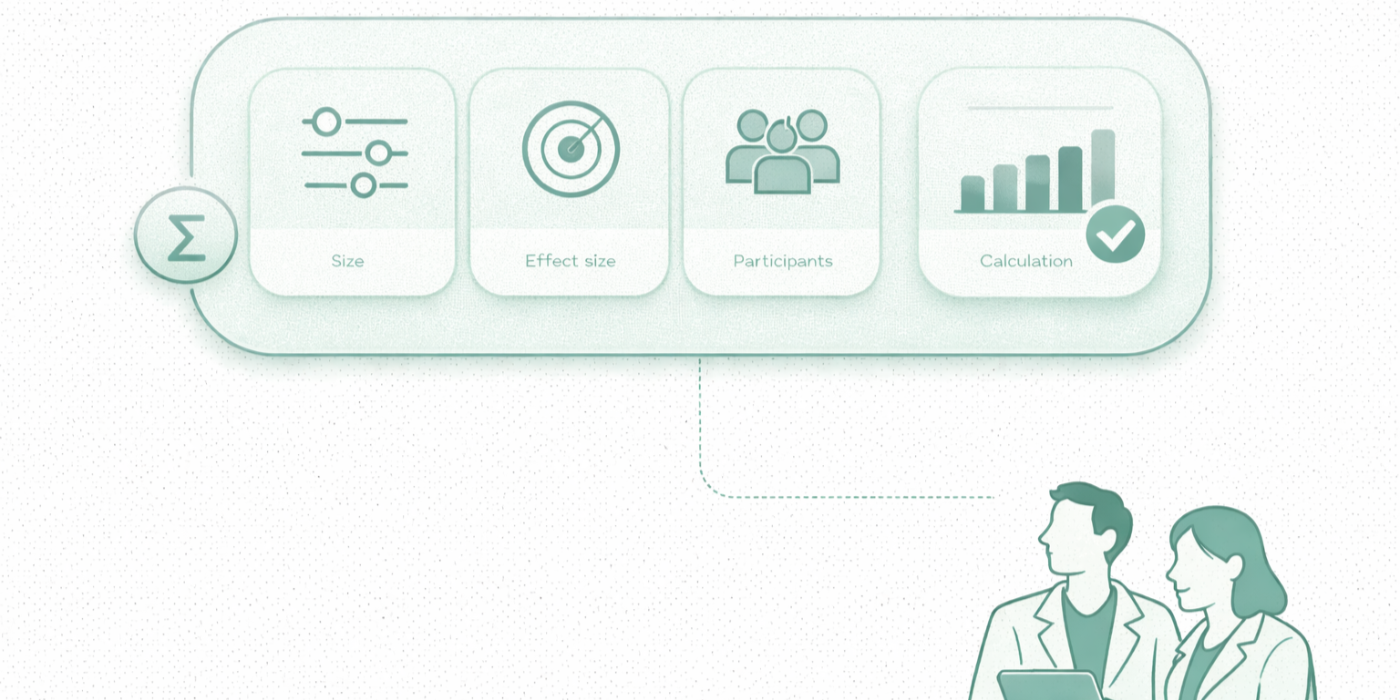
2. What a strong instant interactive sample size calculator should actually include
Many sample size tools are technically functional but practically weak. They return a number fast, yet they do not help the user understand whether the number is credible, what assumptions drove it, or whether the resulting study is even feasible. A strong interactive calculator should do more than compress a formula into a webpage. It should make the user think like a better trial designer.
The first feature it needs is endpoint-aware logic. Sample size requirements differ depending on whether the study compares means, proportions, time-to-event outcomes, paired data, noninferiority hypotheses, or cluster-randomized designs. An interactive tool that does not force the user to choose the correct endpoint framework can create false confidence immediately. That is why good design should be tied to concepts like primary vs secondary endpoints, placebo-controlled trials, data monitoring committee roles, and case report form design.
Second, the calculator should explain inputs in plain language. “Effect size,” “power,” and “alpha” mean something to statisticians, but many coordinators, investigators, project managers, and newer researchers use these terms loosely. If the tool claims to be interactive, it should guide the user with short explanations, not assume fluency. A calculator becomes much more valuable when it teaches users that a smaller expected treatment effect increases required enrollment, that higher variability punishes optimism, and that dropout inflation is not optional fluff.
Third, it should display both the ideal sample and the operational sample. These are not always the same. The ideal sample might be 220 randomized participants, but if the expected dropout is 18% and the screen failure rate is 35%, the study may need to screen more than 400 people to get there. That difference is operational gold because it changes budgeting, site planning, enrollment forecasting, and timeline realism. This is where the calculator becomes strategically useful for teams focused on clinical trial resource allocation, vendor management in clinical trials, effective stakeholder communication, and state of clinical trials insights.
Fourth, a strong calculator should show sensitivity scenarios. One number is seductive, but scenario ranges are more honest. What happens if dropout rises from 10% to 20%? What if the expected effect shrinks from moderate to small? What if unequal allocation is chosen? These scenario toggles help prevent a design team from anchoring on a single fragile estimate.
Fifth, the tool should connect the math to participant and site burden. That means explaining that every upward shift in sample size increases coordinator workload, monitoring load, data review demand, investigational product logistics, query volume, visit scheduling pressure, and participant-management complexity. Once users can see that connection, sample size stops being abstract and becomes operationally real.
A truly strong tool is therefore part calculator, part teaching engine, and part feasibility mirror. It does not merely tell users what number the formula returns. It helps them understand whether the planned study deserves that number and can survive it.
3. The biggest mistakes teams make when using sample size calculators
The first mistake is entering hopeful assumptions instead of defensible ones. Many teams start with the effect size they want rather than the effect size they can justify. That choice quietly poisons the entire design. If the expected effect is inflated, the required sample looks smaller, the study looks cheaper, and the timeline looks easier. But the comfort is false. What the team really did was hide risk inside optimism.
The second mistake is confusing statistical sufficiency with operational feasibility. A calculator can output a perfectly reasonable randomized sample, but that does not mean the site network can recruit it or the participants can complete it. If the protocol is burdensome, the eligible population is narrow, or the endpoint is noisy, a statistically valid target can still be operationally unrealistic. This is why calculator outputs must be read alongside clinical trial patient recruitment and retention trends, clinical trial volunteer registries and platforms, top clinical trial patient recruitment companies, and top hospitals and health systems running clinical trials.
The third mistake is forgetting dropout and missing data. Teams often remember attrition only after the first enrollment forecast misses. But by then the calculator has already done its damage, because the study budget, site count, and accrual plan were built on a cleaner world than the actual study will ever inhabit. This is especially dangerous in long follow-up studies, decentralized models, CNS studies, pediatric trials, rare disease programs, and studies with intensive diary or device burden.
The fourth mistake is using the wrong calculator for the design. Binary outcomes are not continuous outcomes. Event-driven trials are not simple parallel mean comparisons. Cluster-randomized studies cannot be treated like individually randomized trials. Noninferiority logic is not superiority logic. The formula mismatch problem is more common than many teams admit, especially when users download a spreadsheet or open an online tool without fully understanding the design assumptions underneath it.
The fifth mistake is treating the output as final truth instead of a decision-support estimate. Good study design is iterative. The calculator output should trigger questions. Is the endpoint reliable enough? Is the effect clinically meaningful? Can the site network recruit this? Will dropout destroy evaluable power? Should the protocol be simplified instead of the sample inflated? Those are not annoying follow-ups. They are the real work. This is why strong sample planning aligns naturally with clinical trial protocol management, GCP compliance essentials for CRAs, managing clinical trial documentation, and research compliance and ethics mastery.
The sixth mistake is ignoring what the sample size says about the protocol itself. Sometimes a huge required sample is not a sign that more participants are needed. It is a signal that the endpoint is weak, the measurement is noisy, the eligibility rules are too broad, or the design is trying to detect an effect too small to be strategically useful. The calculator, in that sense, can reveal when the study needs redesign more than headcount.
4. How to use an interactive sample size calculator the right way
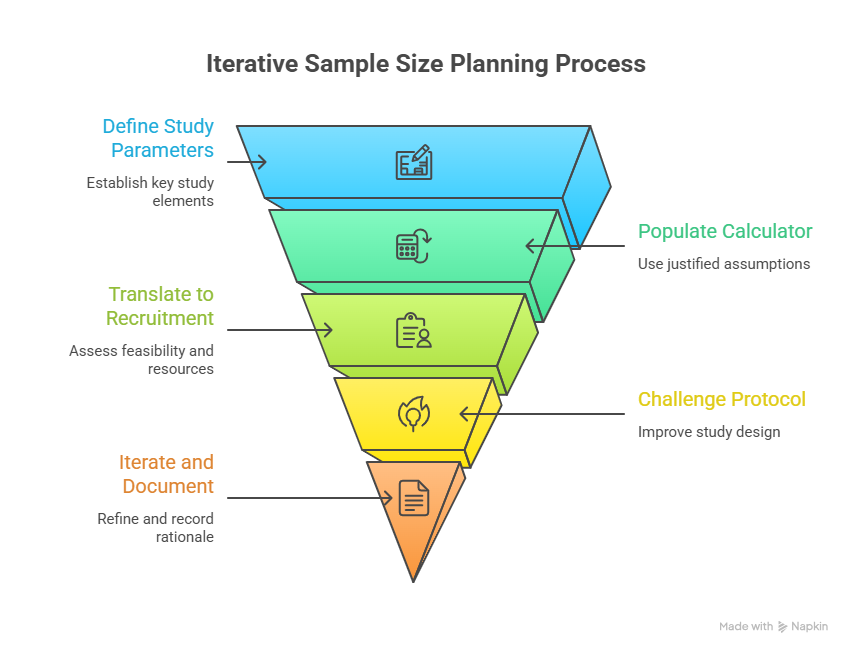
The right way to use a sample size calculator is to start with the study question, not the math. Before entering any numbers, the team should know the primary endpoint, comparison structure, analysis framework, target population, and what treatment difference would actually matter clinically. Without that foundation, the tool will still output a number, but the number will be strategically empty.
Next, populate the calculator with justified assumptions, not convenient ones. Historical trials, pilot data, registry evidence, published literature, internal development data, and disease-specific benchmarks should all inform the input values. If uncertainty is high, do not hide it. Model ranges. Compare conservative, expected, and optimistic scenarios. This is especially important when the study population is heterogeneous, the measurement approach is new, or the endpoint has a high placebo component.
Then translate the output into recruitment reality. If the calculator says 300 randomized participants are needed, the team should ask how many must be screened, how many sites are required, how long recruitment will take, how much retention pressure the protocol creates, and whether the budget can tolerate that scale. In other words, sample size should flow immediately into feasibility planning. That is where it meets top CRO market share and industry structure, top clinical trial sites and SMOs, top academic medical centers with active trials, and top contract research vendors and solutions platforms.
The next step is to challenge the protocol. If the required sample looks operationally painful, the answer is not always to accept the pain. It may be better to improve endpoint reliability, reduce participant burden, sharpen eligibility, refine stratification, or rethink the design architecture. Sometimes the cleanest way to reduce sample size is not statistical cleverness but better study design.
A strong team also uses the calculator repeatedly across the life of protocol development. Early concept stage may use broad ranges. Protocol drafting may refine them. Feasibility work may reshape dropout assumptions. Statistical review may tighten the alpha strategy. Operational planning may expose that the original target is unrealistic. The calculator should therefore be part of an iterative design loop, not a one-time checkbox.
Most importantly, the team should document the rationale behind the chosen inputs. That creates transparency for internal review, ethics committees, investigators, monitors, and future protocol amendments. It also improves organizational learning. When a study under-recruits or experiences more attrition than planned, the team can compare what was assumed with what actually happened and get smarter next time.
5. Why sample size tools are becoming essential for modern clinical research teams
Modern research teams face an environment of tighter budgets, more complex endpoints, higher stakeholder scrutiny, and stronger pressure to justify design choices early. In that environment, an instant interactive sample size tool becomes more than a convenience. It becomes a shared planning language across statisticians, coordinators, CRAs, investigators, project managers, and sponsors.
For coordinators and site staff, it helps explain why a study’s recruitment goals may be difficult or why dropout assumptions must be taken seriously. For CRAs and project managers, it helps link enrollment forecasting to risk. For investigators, it strengthens scientific and ethical understanding. For sponsors, it reveals whether the study question they want answered is compatible with the operational reality they are willing to fund. This makes sample size planning highly relevant to roles like clinical research coordinator, clinical research associate, clinical trial manager, and clinical research project manager.
These tools also support better education. Research professionals often learn sample size concepts in fragments, but a strong interactive calculator can make those concepts tangible. Instead of abstract lectures about power, users can see how changing assumptions reshapes the study. That kind of direct feedback improves judgment faster than passive explanation alone.
There is also a strategic future angle. As trials become more data-rich and adaptive, sample size tools may increasingly connect with clinical research technology adoption, AI-powered clinical trials, predicting patient dropout, and how AI will predict clinical trial failures before they happen. A future-facing calculator might not only compute a sample target but also integrate dropout risk forecasts, site-performance assumptions, or scenario planning based on historical operational data.
Even without those advanced layers, the core value is already clear. Sample size tools make hidden assumptions visible. And in clinical research, visibility is power. Once assumptions are visible, they can be challenged, improved, defended, or replaced. That alone makes an instant interactive sample size calculator one of the most useful planning assets a serious clinical research organization can deploy.
6. FAQs
-
A clinical trial sample size calculator estimates how many participants a study likely needs to detect a planned treatment effect with a chosen level of statistical power and significance. Depending on the tool, it may also account for endpoint type, variance, event rate, dropout, allocation ratio, and other design assumptions that influence how large the study must be.
-
Sample size affects whether a study can answer its scientific question credibly. If the sample is too small, the trial may fail to detect a real effect. If it is too large, the study may become inefficient, expensive, and ethically harder to justify. Sample size also drives recruitment burden, site workload, budget pressure, and timeline feasibility.
-
Not exactly. It gives an estimate based on the assumptions entered. If those assumptions are weak, the output can be misleading. The calculator is only as strong as the endpoint choice, effect size rationale, variability estimate, dropout planning, and design match behind it. It should support judgment, not replace it.
-
One of the most common mistakes is entering optimistic assumptions to make the study appear smaller and more manageable. Teams often overestimate effect size, underestimate variability, or ignore dropout and screen failure. That makes the initial design look attractive but creates serious risk once the study begins operating in the real world.
-
Yes, absolutely. The base sample size may tell you how many randomized participants are needed for the analysis, but real studies also lose people during screening and follow-up. A practical calculator or tool should help users estimate both the randomized target and the larger screened population needed to achieve it.
-
It is useful for biostatisticians, investigators, clinical research coordinators, CRAs, project managers, protocol authors, sponsors, and even students preparing for clinical research roles. Anyone involved in study planning benefits from understanding how sample size assumptions shape feasibility, ethics, and the odds that the trial will actually succeed.