
Clinical Trial Cost Estimator: Interactive Budgeting Tool
Clinical trial budgets fail when teams underestimate operational friction, not when they forget obvious line items. A strong clinical trial cost estimator forces study planners to convert vague optimism into defendable assumptions about enrollment speed, monitoring intensity, vendor scope, startup delays, protocol complexity, and downstream data cleaning. That matters because one weak budget can distort feasibility, damage site relationships, slow recruitment, and trigger amendments that cost far more than the original oversight.
This guide explains how to build an interactive budgeting tool that actually helps sponsors, CROs, site teams, and clinical operations professionals make faster, smarter decisions before costs start compounding.
1. Clinical Trial Cost Estimator: What It Should Actually Calculate
A real clinical trial cost estimator is not a glorified spreadsheet that adds site fees and visit costs. It is a decision tool that models how protocol design, operational structure, patient flow, oversight burden, and vendor choices shape total spend over time. If your estimator ignores the relationship between sample size assumptions, primary and secondary endpoints, randomization design, blinding requirements, and placebo-controlled trial complexity, it will mislead users precisely when they need clarity.
The best estimator helps teams answer harder questions. How much does each protocol amendment do to startup lag, site retraining, database changes, and monitoring? What happens if recruitment slips by 30 percent? When does remote monitoring reduce cost, and when does it simply push more work into documentation cleanup? Which studies can tolerate lean oversight, and which demand heavier governance from data monitoring committees, medical monitors, and quality auditors? That is where a budgeting tool becomes operationally valuable instead of decorative.
For CCRPS readers, the tool should map directly to the work done by clinical trial project managers, clinical trial managers, CRAs, CRCs, and sponsors responsible for resource allocation, vendor management, budget oversight, and regulatory readiness. If the tool cannot support those workflows, it is too shallow.
2. The Core Inputs That Make a Budgeting Tool Credible
Every high-value estimator starts with study architecture. Users should enter phase, therapeutic area, number of countries, number of sites, target enrollment, visit schedule, treatment duration, follow-up duration, and procedure intensity. Those inputs connect directly to protocol management responsibilities, regulatory document planning, clinical trial documentation under GCP, GCP essentials, and investigational new drug preparation. Without those anchors, total cost is just guesswork with better formatting.
The second layer is volume sensitivity. Your tool should ask how many patients will be screened, not just enrolled. It should estimate the cost effect of screen failures, withdrawals, rescues, repeat assessments, missed visits, protocol deviations, and amendment-driven reconsenting. Those factors have direct ties to patient recruitment reality, informed consent procedures, protocol deviation management, clinical trial amendments, and CRC operational workflow. A budget that treats all enrolled patients as identical is usually the budget that gets destroyed first.
The third layer is oversight intensity. Some trials can run with leaner monitoring, fewer vendors, and straightforward data flow. Others require dense review cycles, frequent on-site visits, heavier safety governance, and more advanced communication structures. The estimator should let users toggle monitoring model, vendor count, medical oversight level, safety burden, and audit preparedness. That makes it more aligned with CRA monitoring techniques, site selection and qualification, investigator site management, sponsor responsibilities, and patient safety oversight.
The final layer is timing. Budgets break when teams assume cost is static while timelines expand. The tool should display both total cost and monthly burn. That helps planners see the difference between a 10-month study and a 16-month study with the same nominal scope. It also links budget logic to project planning, risk management, resource allocation, and career-level operational judgment. Smart users do not just ask, “How much?” They ask, “How fast will this burn?”
3. How To Structure the Interactive Tool So Users Get Decisions, Not Just Numbers
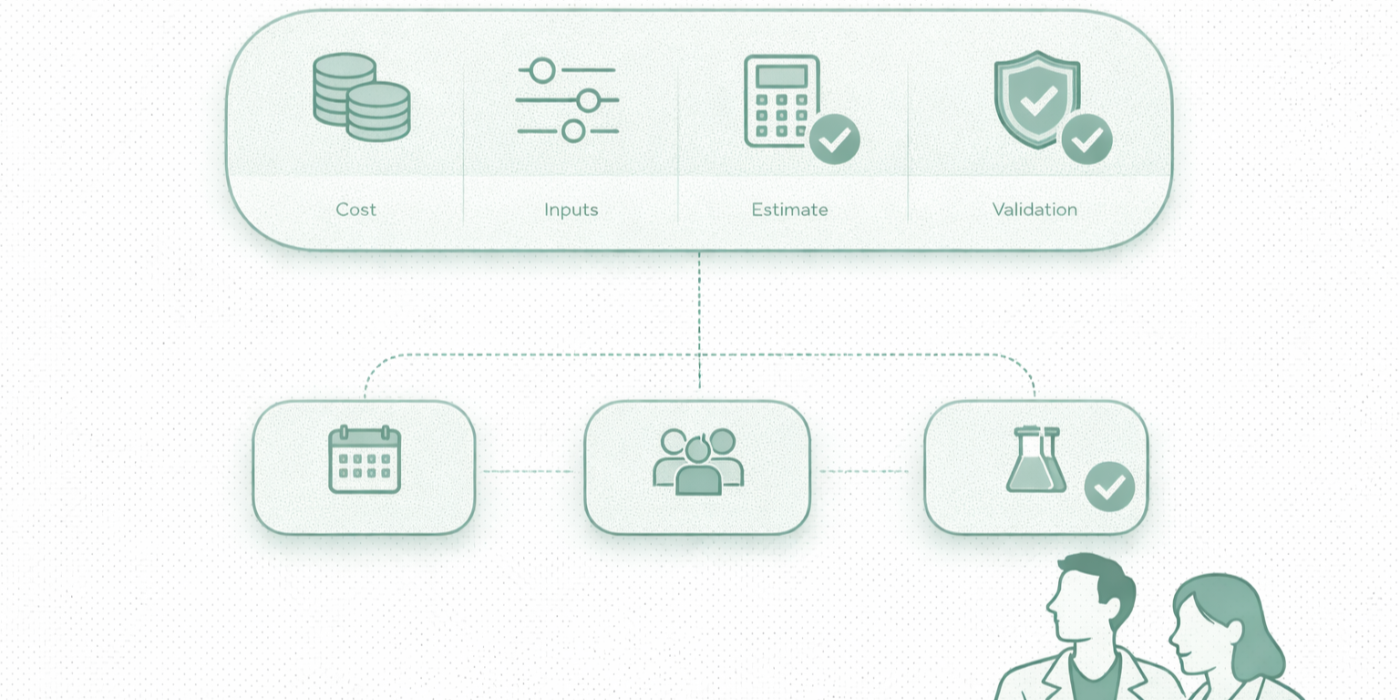
The best layout is modular. Start with a study setup panel. Then move users into patient-flow assumptions, site and vendor assumptions, oversight assumptions, and contingency modeling. Finish with a live summary panel showing startup cost, per-patient variable cost, fixed monthly run cost, vendor subtotal, monitoring subtotal, safety subtotal, and total forecast. For educational value, the tool should also explain why each input matters using logic grounded in case report form design, biostatistics basics, data management systems, and top EDC platform choices.
A powerful feature is scenario comparison. Users should be able to compare conservative, base-case, and aggressive models side by side. In a conservative model, recruitment takes longer, screen failures run higher, monitoring is heavier, and contingency rises. In an aggressive model, site activation is faster and retention is stronger, but the tool should visibly flag what assumptions are carrying more risk. That turns the estimator into a planning instrument rather than a vanity calculator. It also connects naturally to clinical trial auditing readiness, quality compliance work, regulatory affairs strategy, and sponsor governance decisions.
Another high-value layer is cost-per-outcome visibility. Instead of showing only total spend, show cost per randomized patient, cost per completed patient, cost per site activated, and cost per month of operational run time. Those views help sponsors see where inefficiency is accumulating. A protocol with modest per-visit cost can still be financially ugly if dropout is high, data queries explode, or the site network underperforms. That logic belongs beside content on signal detection and management, drug safety timelines, adverse event reporting, and SAE procedures, because safety burden can quietly reshape cost structure long after launch.
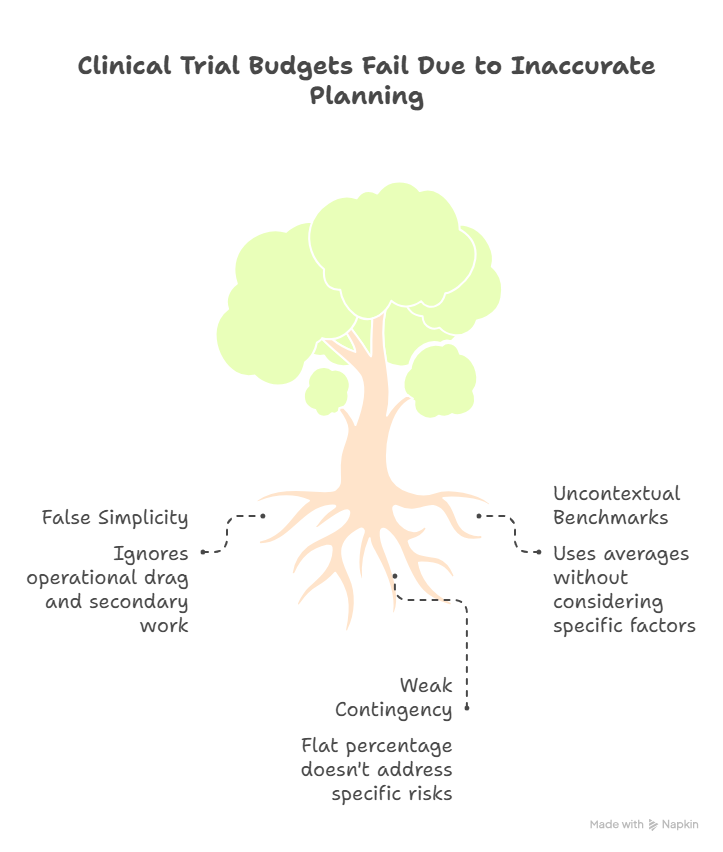
4. The Biggest Reasons Clinical Trial Budgets Fail
The most common failure is false simplicity. Teams reduce budget planning to site payments plus vendor quotes, while ignoring the labor created by operational drag. Every unclear visit window, every overcomplicated CRF, every weak recruitment assumption, and every late amendment creates secondary work. That secondary work hits documentation management, GCP compliance strategies, CRA compliance responsibilities, regulatory submissions, and aggregate reporting workflows long before finance teams realize what is happening.
Another failure point is using benchmark averages without context. Average monitoring cost means little if your site mix is unstable. Average recruitment cost means little if inclusion criteria are narrow, physician referral behavior is weak, or dropout risk is high. Average vendor pricing means little if your internal team lacks the time to govern those vendors tightly. This is why the estimator must force users to qualify assumptions, not just enter them. That approach fits the logic behind clinical trial staffing realities, job market infrastructure, research team leadership, and site-level execution pressure.
A third failure point is weak contingency discipline. Many teams add a flat percentage and call it risk coverage. That is not contingency modeling. A better approach is layered contingency: startup contingency, enrollment contingency, safety contingency, vendor change contingency, and timeline contingency. Each one responds to a different operational trigger. That makes the tool more honest and more useful for decision-makers working across clinical trial sponsor obligations, principal investigator oversight, clinical research administrator coordination, and quality assurance review.
5. How To Use the Estimator for Smarter Planning, Negotiation, and Study Design
A strong cost estimator should be used before protocol finalization, not after. Once teams see how much cost is being driven by unnecessary visit density, redundant assessments, or expensive operational branching, they can simplify the design before the damage becomes permanent. That makes the tool strategically useful for protocol development, study leadership, project planning decisions, and clinical operations advancement. Cheap studies are not always good studies, but cleaner designs often become both cheaper and easier to execute.
The estimator is also powerful in budget negotiations. Sites can use it to justify startup fees, coordinator effort, pharmacy burden, and closeout charges with more precision. Sponsors can use it to compare study models and defend why certain investments reduce downstream waste. CROs can use it to explain why vendor sprawl, unrealistic enrollment targets, or weak contingency assumptions create avoidable exposure. When all parties can see the cost logic, the conversation becomes less emotional and more operational. That is exactly the mindset developed in stakeholder communication strategy, vendor management practice, clinical trial budget oversight, and resource allocation planning.
Finally, the tool becomes an educational asset. It teaches newer professionals how cost really behaves in clinical research. It shows why recruitment is never just a marketing problem, why monitoring is never just a travel budget, and why amendments are never just a regulatory inconvenience. For professionals building toward roles in clinical project management, CRA leadership, CRC execution, and sponsor-side study governance, that kind of visibility is career-shaping because it builds judgment, not just familiarity.
6. FAQs
-
The most important input is not one line item but the combination of enrollment target, screen failure rate, visit intensity, and timeline. Those four variables drive site effort, vendor volume, monitoring frequency, and data workload at the same time. Teams that focus only on per-patient visit fees usually miss the larger cost signal created by slow recruitment and extended study duration. That is why cost forecasting should always sit beside patient recruitment planning, sample size logic, biostatistics framing, and project risk management.
-
It should absolutely include contingency, but not as a lazy flat percentage. The best tools separate startup, enrollment, safety, amendment, and timeline contingencies so users can see which risks are shaping budget exposure. That makes it easier to revise assumptions when study design changes or site performance weakens. This approach aligns with protocol deviation management, SAE reporting procedures, audit preparation, and quality oversight.
-
Budgets should be re-forecasted at major operational milestones: after protocol finalization, after first-site activation, after the first recruitment trend becomes visible, after any major amendment, and before database lock. Studies with volatile recruitment or high safety burden may need monthly review. Re-forecasting is not a sign that the original budget failed. It is a sign that the team is managing reality instead of defending outdated assumptions. That discipline supports clinical documentation control, CRA oversight, sponsor governance, and project-level budget oversight.
-
Smaller site teams should use it aggressively. It helps them defend startup charges, coordinator time, pharmacy handling, and closeout effort with greater confidence. It also helps sites identify where they are accepting underpaid work simply because effort was never translated into budget language. For sites, the estimator becomes both a planning tool and a negotiation shield. That is especially useful when paired with CRC responsibilities, regulatory document management, informed consent best practices, and GCP coordinator strategies.
-
The biggest mistake is treating per-patient cost as if it only includes scheduled visit procedures. In reality, per-patient cost is shaped by screening effort, consent time, coordinator follow-up, missed visit rescheduling, query resolution, safety follow-up, retention work, and closeout-related reconciliation. A patient who looks inexpensive on a visit calendar can become costly when operational friction builds around documentation and compliance. That is why per-patient costing should be grounded in case report form planning, adverse event reporting, clinical trial documentation, and patient safety oversight.
-
A strong estimator reduces overruns by exposing fragile assumptions before they become expensive commitments. It shows where recruitment timelines are too optimistic, where site count is too low for the enrollment target, where monitoring plans are underbuilt, and where amendments or safety burden could overwhelm contingency. That gives teams time to simplify protocol design, renegotiate vendor scope, strengthen startup planning, or build more realistic reserves before activation starts. Used properly, it becomes a prevention tool tied closely to project planning, resource allocation, vendor management, and clinical trial sponsor responsibilities.